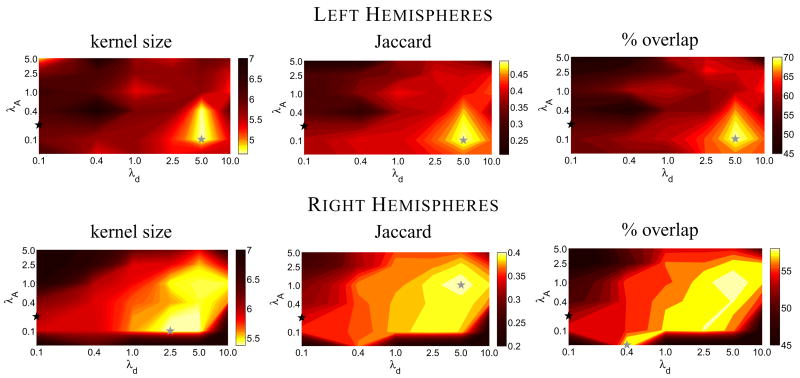
Figure 3.
Alignment quality of V1 computed for several values of λA and λd after three iterations of the template generation process. The top row represents left hemispheres and the bottom row represents right hemispheres. The average kernel size is shown in the first column. Lower sizes represent better V1 alignment, as indicated by the color bars. The Jaccard similarity coefficient for the same parameter values is shown in the second column, with higher values representing better alignment. The third column shows the percent overlap of V1 for all individuals Po(10). In all images, the location of the gray star indicates the parameter values that produced the best V1 alignment for that measure. The location of the black star indicates the parameter value pair commonly employed using this registration method.

