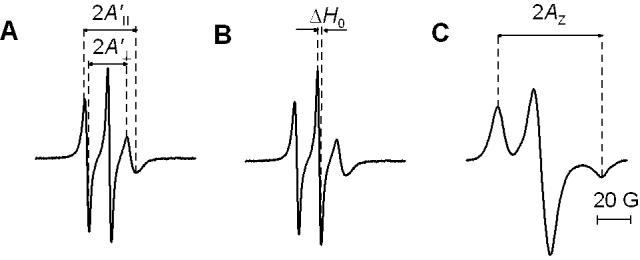
Fig. 2.

EPR spectra of 14-PC in DMPC membranes containing 10 mol% 9-cis zeaxanthin recorded at 35°C (A,B) and -163°C (C). Measured values for evaluating order parameters (A’II and A’⊥) are indicated in (A). In (B) the measured ΔH0 value (peak-to-peak central line width) is indicated. In (C) the measured 2AZ value (z-component of the hyperfine interaction tensor) is indicated.
