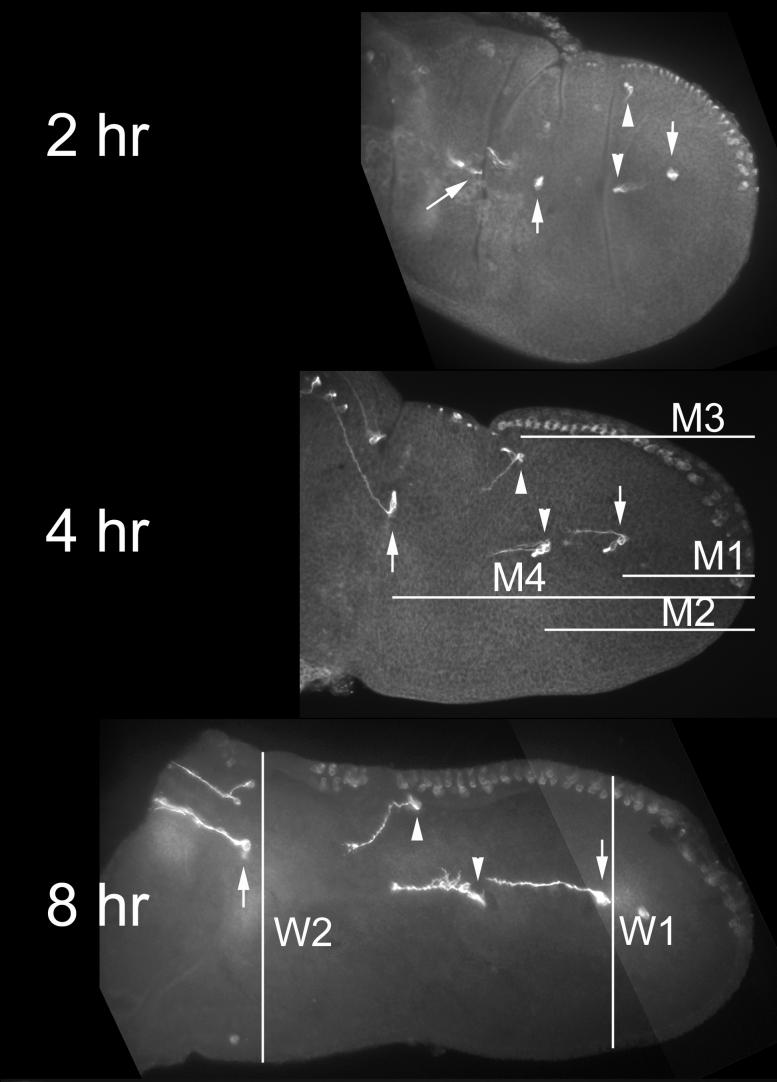
Fig. 2.
Wing evagination. Shown are 2, 4 and 8 hr prepupal wings as well as a 28 hr pupal wing for comparison. The wings were stained with the 22C10 monoclonal antibody which stains neurons. The locations of the various landmark cells are shown on the 2 hr (and in most cases later) images. The downward arrow points to landmark M1, the downward arrowhead to M2, the upward arrowhead to M3, the upward arrow to M4 and the oblique arrow to M5. The lines in the 4 hr image are examples of the M1 through M4 measurements. The lines in the 8 hr image show how the W1 and W2 distances were obtained. Note the dramatic change in the relative position of landmark M3 as development proceeded.

