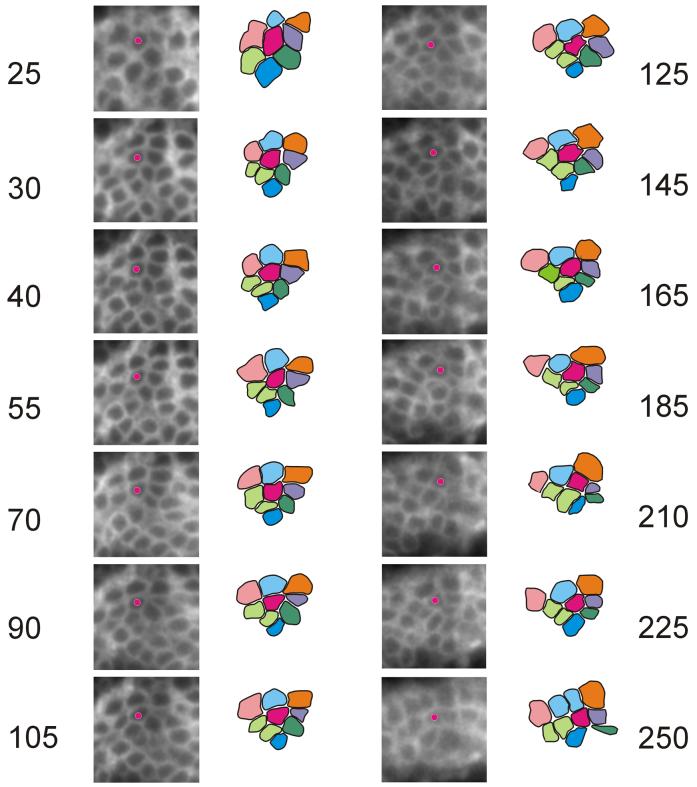
Fig. 7.
Cell rearrangement during evagination. Shown are images from a prepupal leg at various times during a time lapse experiment. The experiment started at about 3 hrs awp. This is the same time lapse experiment that is presented in Supplementary Movie 3. The time in minutes since the beginning of the experiment is shown. The time points chosen were ones that were both informative and where essentially all of the 8 marked cells (and their progeny) were easily visible. Interpretive drawings are shown that identify 8 cells in each of the time points. The magenta cell from the interpretive drawing is marked on the micrographs by a small magenta circle. Two of the 8 cells divided and they are shown in the interpretive drawings as two cells of the same color.

