Fig. 8.
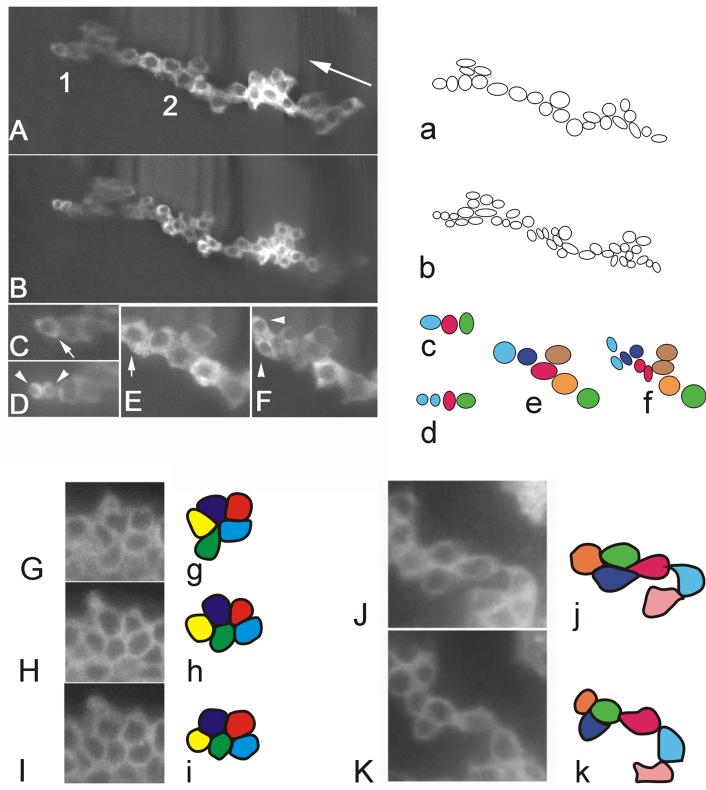
Cell rearrangement and cell division: Panels A and B are of the same MARCM clone at 3.45 and 8 hr. A single optical plane from a stack is shown and some cells are out of the plane of focus. Panels a and b are interpretive drawings of the clone cells from panels A and B. Note the increase in cell number during this period. Panels C and D show a blow up of region 1 from panel A. The arrow in panel is parallel to the proximal/distal axis. The arrow in panel C points to a cell that has divided in panel D. The sister cells are indicated by arrowheads. Panels C and D were the time points right before and after the cell division. Interpretive drawings of the cells in panels C and D are shown in c and d. Panels E and F are a blow up of the cells from region 2 of panel A before and after these cells divide. Interpretive drawings of this are shown in panels e and f. Panels G, H and I are of a small region of the ptc domain from a tibia at three time points spread out over 30 minutes. Interpretive drawings of these images are shown in panels g, h and i. Note the rearrangement of cells resulting in the green and red cells touching each other in panel I, but not G. At the same time the purple and blue cells lose contact. Panels J and K are of part of a large MARCM clone 1 hr apart. Panels j and k are interpretive drawings. Once again note the change in cell neighbors with the purple and red cells losing contact with one another.

