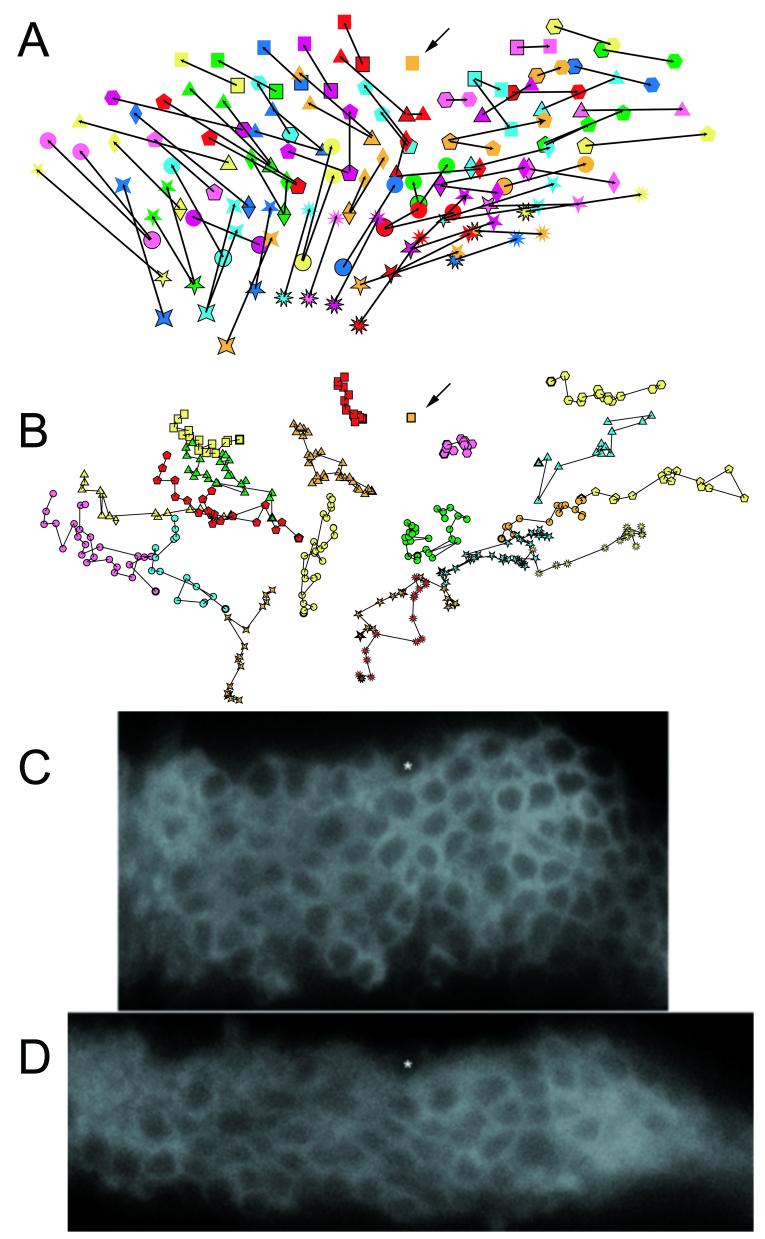
Fig. 9.
Cell movement during evagination. Panel A shows the initial and final positions of cells that could be followed throughout the movie provided in Supplemental Movie 4. The images were all aligned using the orange square cell (marked by an arrow) as an anchor. This simplified the analysis. The leg as a whole moved during the experiment and the slide needed to be re-centered several times. Cells are identified by the same symbols as in Supplementary Movie 4. The images are of cells in the omb domain of an evaginating tarsal segment. Panel B shows the position of a selected subset of cells every 4th time point (every 20 minutes). The earliest time point is identified by a thicker outline. Subsequent time points are over layed. Panel A shows the marked tendency for cells to move upward toward the anchored cell and both proximally and distally. This is as expected for elongation by cell intercalation. The movement was not consistent or sharply directed as is seen in Panel B. Panels C and D are the starting and final images from the movie. The asterisk marks the cell marked with an orange square in panels A and B.

