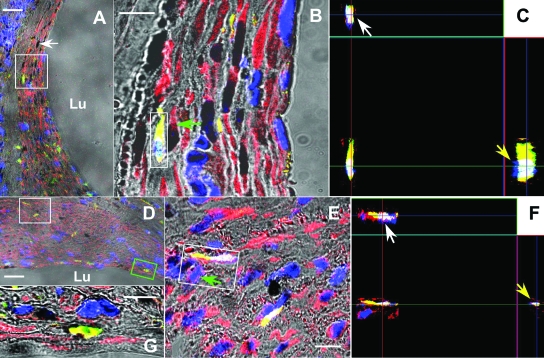
Figure 4.
Orthogonal analysis of bone marrow-derived cells in the neointima 2 (A–C) and 8 weeks (D–G) after grafting. A,D: Typical triple immunofluorescent sections imaged by low resolution (object: ×20) confocal microscopy demonstrating of bone marrow-derived smooth muscle cells. The yellow represents the cytoplasm of the cell staining both with anti-GFP (fluorescein isothiocyanate) and anti-smooth muscle heavy chain (Alexa 594). The black stain (white arrow) represents nuclei staining PCNA (black), non-PCNA-staining nuclei appear blue (DAPI). Bar = 40 μm, Lu, lumen. B,E: High-resolution pictures (object: ×100) from area within the white box in A and D, respectively. Bar = 10 μm. C,F: X-Z (white arrows) and Y-Z (yellow arrows) imaging from the area within the white box in B and E, respectively, demonstrating that the yellow fluorescent signal is not derived from neighboring smooth muscle cells, green arrows in B and E, or overlapping cells. G: A cell that stains both with smooth muscle myosin heavy chain and GFP (yellow, outlined by a green box in D) has a PCNA positive-nucleus (black area).

