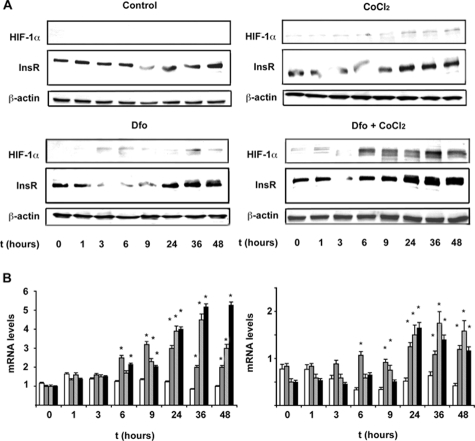
Figure 3.
Effect of Dfo and CoCl2 on the time-course expression of InsR. A: Time-course expression of HIF-1α and InsR protein levels in HepG2 hepatocytes untreated, treated with Dfo (100 μmol/L), CoCl2 (150 μmol/L), or with Dfo (100 μmol/L) and CoCl2 (150 μmol/L). β-Actin is shown as a control. B: Time-course expression (normalized mRNA levels) of Glut1 (left panel) and InsR (right panel), as evaluated by qRT-PCR. White bars, untreated HepG2 cells; gray bars, cells treated with Dfo (100 μmol/L); dashed bars, cells treated with CoCl2 (150 μmol/L); black bars, cells treated with Dfo (100 μmol/L) and CoCl2 (150 μmol/L). *P < 0.05, **P < 0.005 for treated versus untreated cells.

