
Figure 5.
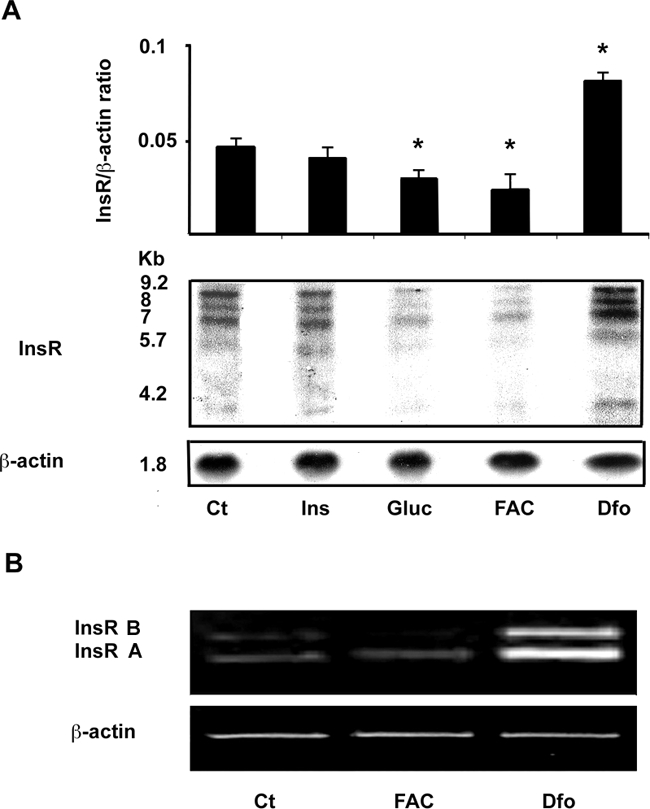
Effect of iron manipulation on InsR expression in HepG2 cells. A: Northern blot analysis of InsR mRNA. Cells were incubated with insulin (0.33 μmol/L, Ins), glucose (33 mmol/L, Gluc), FAC (150 μmol/L), and Dfo (100 μmol/L) for 24 hours. β-Actin probe is shown as reference standard. The relative quantification presented above is representative of two independent experiments. *P < 0.05 versus untreated cells. B: RT-PCR of InsR mRNA. Cells were treated with FAC and Dfo as above. The primers generated two fragments encoding the B and A isoform of InsR; β-actin cDNA was used as reference standard.