
Figure 8.
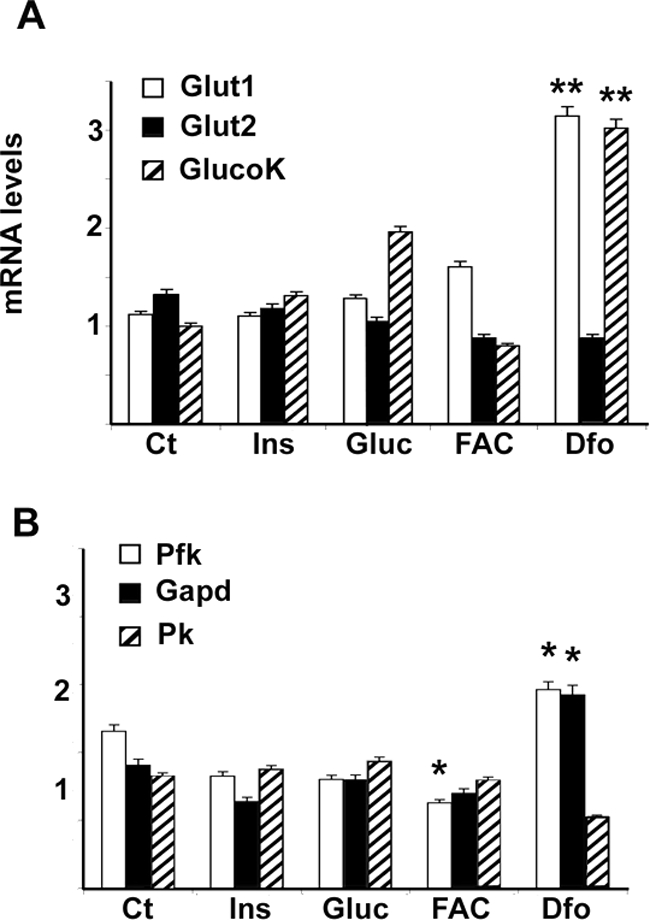
Effect of iron status on the expression of genes involved in glucose uptake and glycolysis in HepG2 cells, as evaluated by qRT-PCR. A and B: Cells were treated as described in the legend of Figure 4; mRNA levels adjusted for β-actin. Results are mean values of three independent experiments. GlucoK, glucokinase; Pfk, phosphofructokinase; Gapd, glyceraldehyde-3-phosphatedehydrogenase; Pk, pyruvate kinase. **P < 0.005.