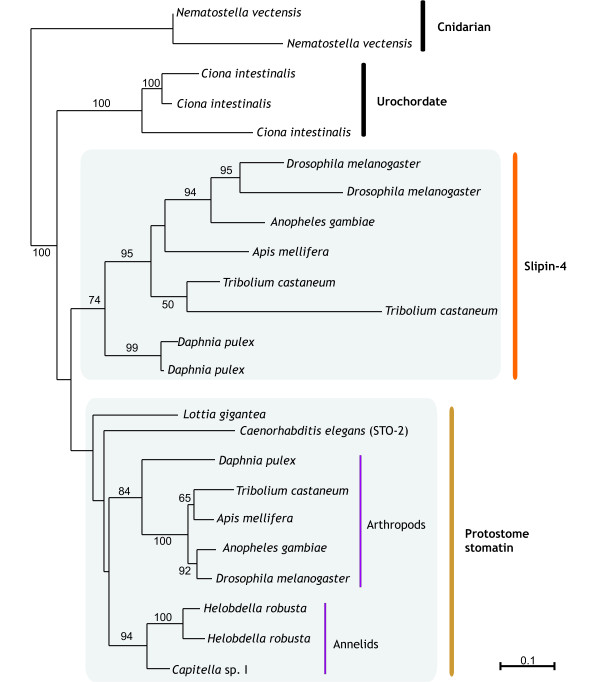
Figure 4.
Maximum likelihood tree of protostome slipins. Phylogenies were based on a 239 amino acid alignment. The scale bar indicates the number of amino acid substitutions per site. 100 bootstraps were performed and values ≥ 50 are shown on each branch. Cnidarian sequences were included to root the phylogeny whilst the sea urchin Ciona intestinalis sequences were included to allow comparison with Fig. 5. Accession numbers available in Additional file 2.

