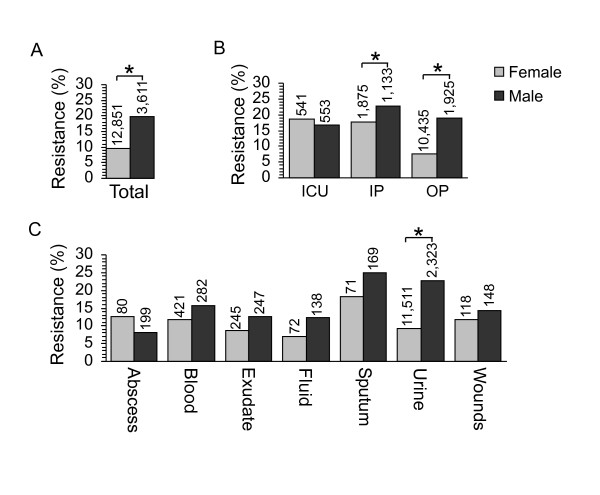
Figure 3.
Fluoroquinolone resistance as a function of patient sex. Asterisks denote statistically significant differences. All data were analyzed by binary regression and Chi-square tests. (A) The percentage of resistant isolates is shown for female and male patients. (B) Fluoroquinolone resistance in female and male patients as a function of location. Because so few fluoroquinolone-resistant genital isolates existed, these data were excluded from analysis. (C) Fluoroquinolone resistance in female and male patients as a function of culture site.

