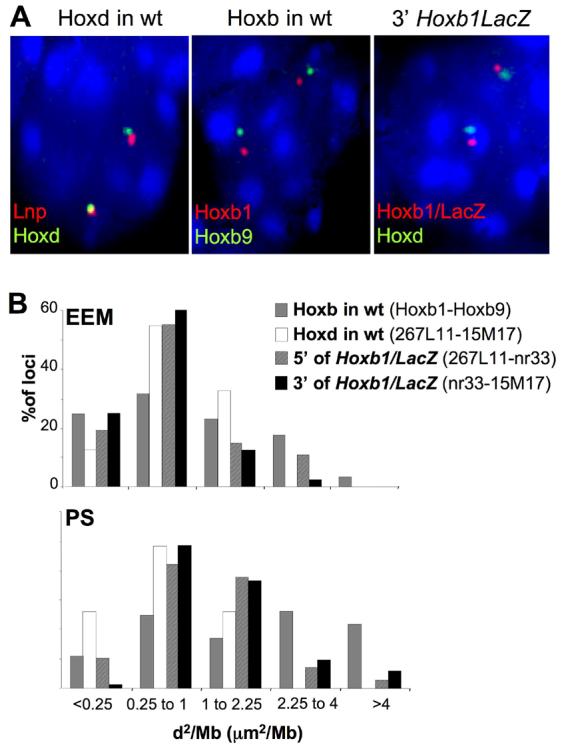
Figure 3.

Chromatin decondensation in E7.5 transgenic embryos. (A) 3D DNA-FISH of, left panel; Lnp and Hoxd, middle panel; Hoxb1 and Hoxb9 probes on nuclei from the PS of E7.5 wild-type embryos, and of, right panel; Hoxb1/LacZ and Hoxd probes on nuclei from the PS of an E7.5 Hoxb1/LacZ embryo. Nuclei were counterstained with DAPI. Images are maximal projections of 3D stacks after deconvolution. (B) Distributions of mean-squared interphase distances (d2) in μm2 normalised to genomic separation (in Mb) measured; between the Hoxb1 and Hoxb9 probes (grey bars) at endogenous Hoxb and between Lnp and Hoxd probes (white bars) at endogenous Hoxd in EEM and PS nuclei from E7.5 wt embryos, or between the Lnp and Hoxb1/LacZ probes (hatched bars) and between the Hoxb1/LacZ and Hoxd probes (black bars) in EEM and PS nuclei from E7.5 Hoxb1/LacZ embryos.
