
Figure 4.
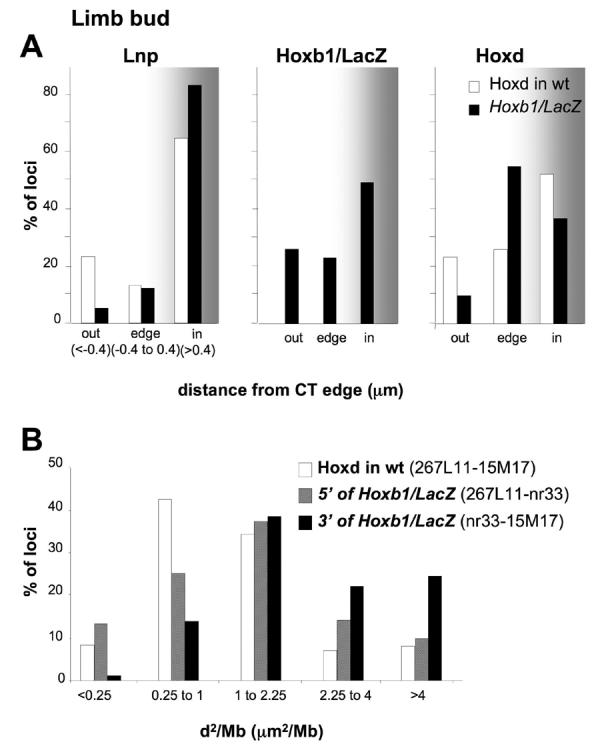
Nuclear reorganisation and chromatin decondensation in the limb bud of E9.5 Hoxb1/LacZ embryos. (A) Histograms showing the percentage of Lnp, Hoxb1/LacZ or Hoxd hybridisation signals inside, at the edge or outside of the MMU2 CT in the forelimb bud of E9.5 Hoxb1/LacZ embryos (black bars) compared to the endogenous Hoxd (white bars). The cut-offs used for the edge category are 0.4 μm and −0.4 μm from CT edge. (B) Distributions of squared interphase distances (d2) in μm2 standardised to genomic separation (in Mb) measured; between Lnp and Hoxd probes (white bars) at endogenous Hoxd in forelimb bud nuclei from E9.5 wt embryos, or between the Lnp and Hoxb1/LacZ probes (hatched bars) and between the Hoxb1/LacZ and Hoxd probes (black bars) in forelimb nuclei from E9.5 Hoxb1/LacZ embryos.