Figure 5.

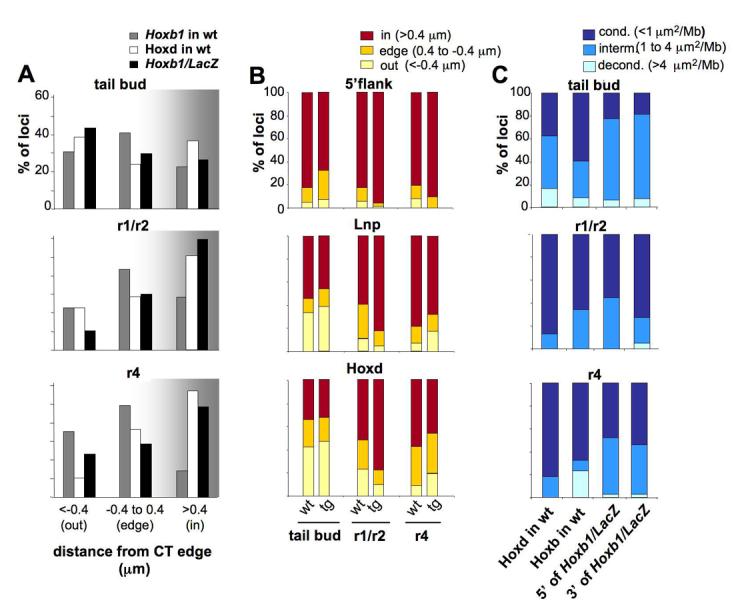
Nuclear reorganisation of the Hoxb1/LacZ transgene and surrounding regions along the antero-posterior axis of E9.5 embryos. (A) Histograms showing the percentage of Hoxb1/LacZ hybridisation signals inside, at the edge or outside of the MMU2 CT in the tailbud, r1/r2 or r4 or of E9.5 Hoxb1/LacZ embryos (black bars) compared to endogenous Hoxd (white bars) or endogenous Hoxb1 on MMU11 in wild-type E9.5 embryos (grey bars). (B) Histograms showing the percentage of signals located either inside (red bars), at the edge (orange bars) or outside (yellow bars) of the CT for the 5'flanking, the Lnp and the Hoxd probes in tailbud, r1/r2 or r4 of either wild-type (wt) or Hoxb1/LacZ transgenic (tg) embryos. (C) Percentages of nuclei showing condensed (dark blue), intermediate (blue) or decondensed (light blue) chromatin structures for the regions between Lnp and Hoxd probe signals (Hoxd wt) and between Hoxb1 and Hoxb9 probe signals (Hoxb wt) in tailbud, r1/r2 or r4 of wild-type embryos or between Lnp and Hoxb1/LacZ probe signals (5'Hoxb1/LacZ) and between Hoxb1/LacZ and Hoxd probe signals (3'Hoxb1/LacZ) in Hoxb1/LacZ embryos.
