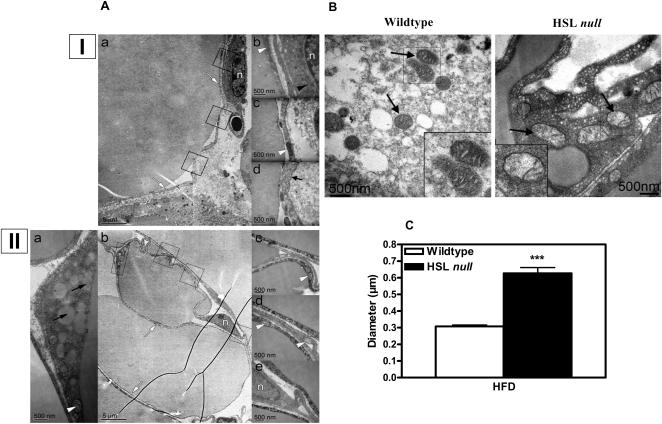
Figure 7. Increased mitochondrial size in adipocytes from WAT of HFD-fed HSL null mice.
(A) Representative electron microscope (TEM) images of periovarial WAT from 10–12 months old wildtype (I) and HSL null mice (II) fed HFD for 6 months. (I)a shows a low-magnification overview image with details from the boxed-in areas shown in (I)b, c and d. For the HSL null mice, (II)b is the overview image and (II)a, c, d and e are the details from the boxed-in areas. Black arrows indicate small lipid droplets in the cytoplasm, black short arrow indicates caveolae, black arrowhead indicates ER, white arrows indicate cytoplasm, white arrowheads indicate mitochondria and n indicates the nucleus. (B) Representative TEM image of periovarial WAT from 10–12 months old wildtype and HSL null mice fed HFD for 6 months. Black arrows indicate location of mitochondria. Insets show enlargement of representative mitochondria. (C) The diameter of mitochondria in WAT was determined using morphometry and based on 140 wildtype and 105 HSL null mitochondria. Values given are mean±SEM, *** p<0.001, analyzed with Mann-Whitney U tests and multiple regression analysis.

