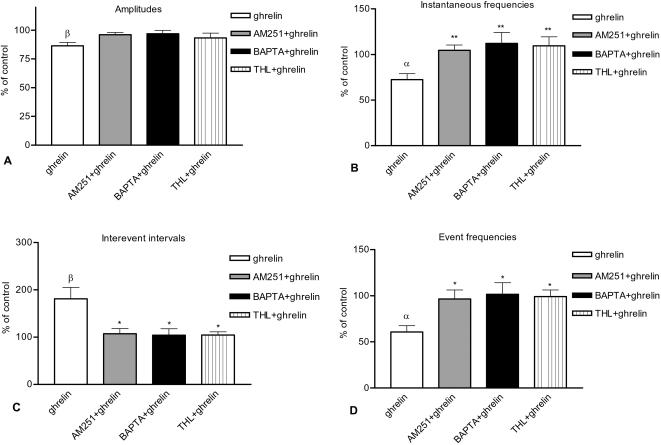
Figure 3. Changes of various parameters of mEPSCs [(A) amplitude, (B) instantaneous frequency, (C) interevent interval, (D) event frequency] elicited by ghrelin (as percentage of control), by AM251+ghrelin (as percentage of AM251 alone), BAPTA+ghrelin (as percentage of BAPTA alone) and THL+ghrelin (as percentage of THL alone) in the parvocellular neurons.
Application of ghrelin resulted in significant changes in all of these parameters whereas administration of AM251, BAPTA or THL eliminated the changes (Fig. 3A–D). All data shown as mean±SEM, α and β correspond to P<0.05 and P<0.01, respectively, and refer to the comparison of ghrelin vs. control. *P<0.05 and **P<0.01 correspond to the comparison between ghrelin vs. AM251+ghrelin, ghrelin vs. BAPTA+ghrelin or ghrelin vs. THL+ghrelin groups.

