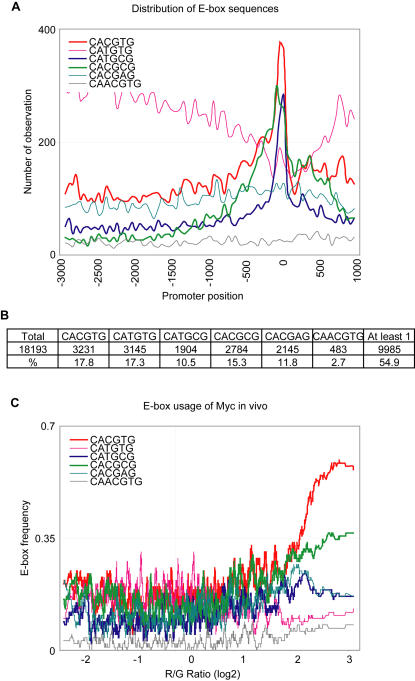
Figure 4. Distribution of E-box elements in human promoters and in vivo usage of E-box sequences in HeLa cells.
(A) Distribution (number of occurrences per bin as a function of position relative to the transcription start site (+1, TSS)) of each E-box sequence is shown. Of the six previously defined E-box sequences, CACGTG, CATGCG, and CACGCG were well clustered near the TSS region. A bin size of 50, and a total of 18,193 promoter sequences spanning 3 kb upstream and 1 kb downstream of the TSS were used in this analysis. (B) Number of promoters that contained each E-box element in the region between −800 bp, and +200 bp of the TSS. (C) The relationship between the presence of each E-box sequence in the promoter region (between −800 bp, and +200 bp of the TSS), and Myc binding represented by the log2 red/green ratio on the X axis. The Y-axis represents the frequency of each E-box element. A moving window average (size 100) was applied to the frequency of the E-box sequence. The canonical E-box sequence CACGTG, and the non-canonical E-box sequence CACGCG in promoters showed the strongest correlation with Myc binding to its target promoters in HeLa cells.

