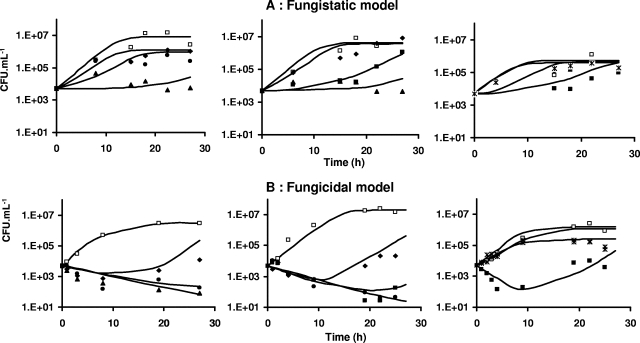
FIG. 3.
Plots showing CFU·ml−1 of fungi over time for the fungistatic (A) and fungicidal (B) models. Each graph represents one experiment. Symbols for fungistatic experiments shown in panel A: control, □; C0 = 100 μg·ml−1, ▴; C0 = 10 μg·ml−1, ▪; C0 = 1 μg·ml−1, •; C0 = 0.1 μg·ml−1, ⧫; C0 = 0.01 μg·ml−1, *. Symbols for fungicidal experiments shown in panel B: control, □; C0 = 10 μg·ml−1, ▴; C0 = 1 μg·ml−1, •; C0 = 0.1 μg·ml−1, ▪; C0 = 0.01 μg·ml−1, ⧫; C0 = 0.001 μg·ml−1, *. Lines represent individual predictions based on the developed PK-PD models.

