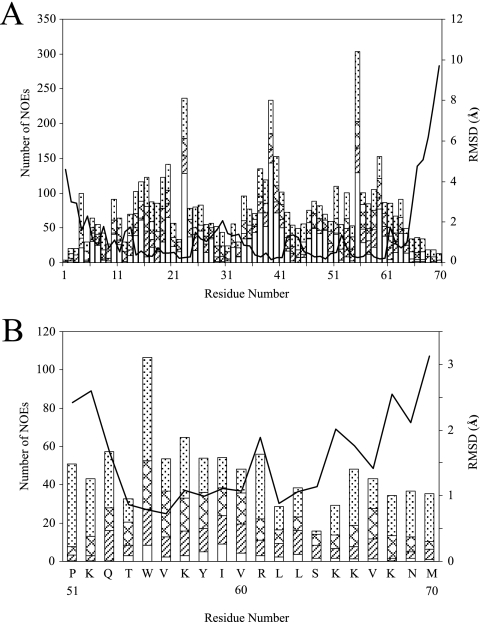
FIG. 1.
Number of NOEs per residue and RMSD plot for the MIP-3α protein (A) and its 20-residue C-terminal peptide (B). Intraresidue (dotted bars), sequential (zigzagged bars), medium-range (striped bars), and long-range (white bars) NOEs are shown. The lines represent the RMSDs per residue for the 20 lowest-energy structures.

