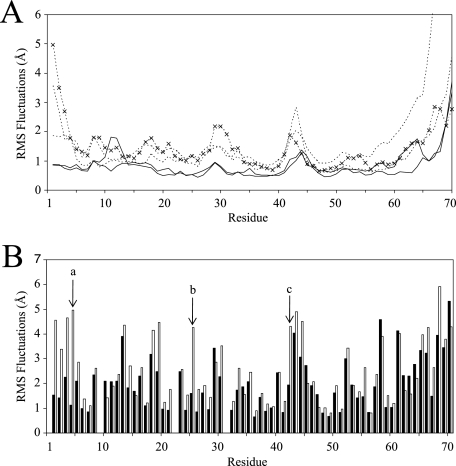
FIG. 4.
RMSF plots of the MIP-3α MD simulations shown for each residue. (A) Backbone RMSF plots for each MIP-3α monomer. Notice the elevated backbone fluctuations of the monomeric simulations (dotted lines) throughout the protein compared to the fluctuations of the dimer simulation (solid lines). ×, plot from the simulation conducted with the NMR solution structure. (B) Side chain RMSF plots averaged over the last 30 ns of the monomer (empty bars) and dimer (filled bars) simulations. The far N-terminal residues most noticeably display the largest decreases in fluctuations between the monomeric and the dimeric MIP-3α simulations. The side chain fluctuations of Phe4, Arg25, and Lys42 are marked a, b, and c, respectively.

