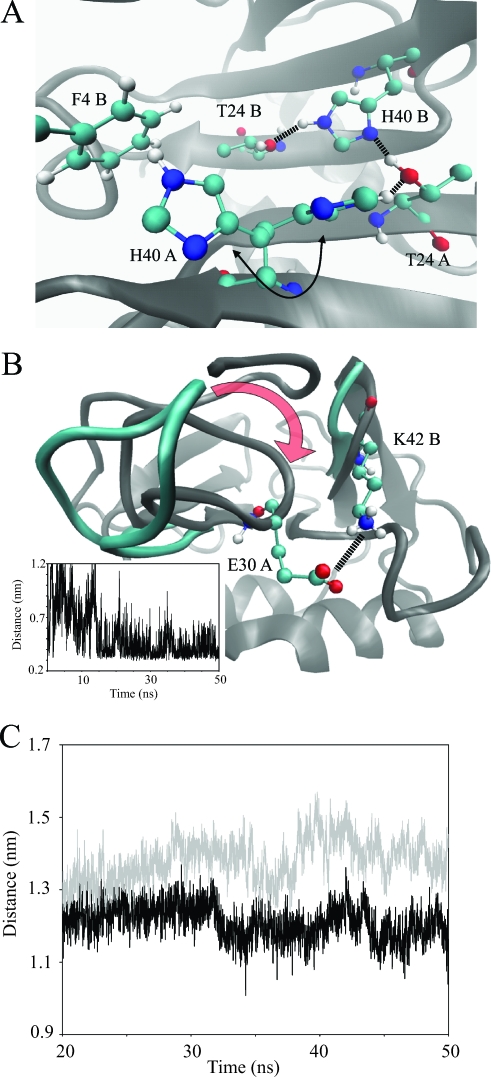
FIG. 5.
(A) Close-up view of the dimer interface and the key interactions observed during the MD simulation. His40 residues interact with each other and participate in hydrogen bonding with Thr24. The His40 of one monomer is shown in two orientations (arrow), as it is observed during the simulation to flip from interacting with Thr24 to interacting with Phe4 of the adjacent monomer. (B) Another view of the dimer interface and, more specifically, the gap between the 30s and 40s loops of adjacent monomers. During the simulation, the 40s loop moves to close the gap to the 30s loop, as indicated by the red arrow. During this process a salt bridge forms between the side chains of Lys42 and Glu30, as shown by the distance plot (see the inset). (C) Average binding groove size measured between the Cαs of Leu15 and Lys43 in the monomeric (gray) and dimeric (black) MD simulations. After initial equilibration, the binding groove is consistently larger in the monomer simulations than in the dimer simulations. Panels A and B were prepared with the VMD program (30).

