FIG. 6.
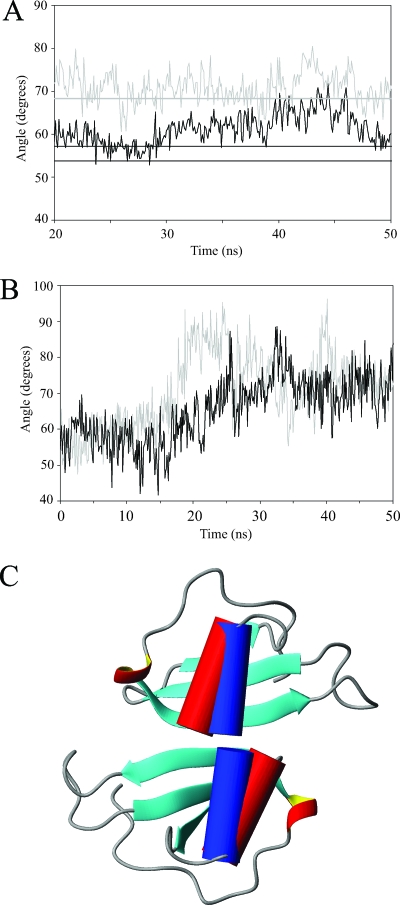
(A) Plots of the average angles between the α helix and the β sheet of MIP-3α over the last 30 ns of the MD simulations. The gray curve and the straight line represent the average angle in the monomer simulations and the average angle seen in the NMR structures, respectively. The black curve shows the average angle seen in the MIP-3α dimer simulation. The two black lines represent the helix angles in each of the monomers of the 1M8A crystal dimer structure. (B) Individual helix angles relative to the β strands of the monA and monB simulations, based on the MIP-3α dimer structure, but simulated as monomers. The helix angles increase drastically over the course of the simulation to resemble those observed in the monomeric solution structure and the MD simulation thereof. (C) Ribbon diagram of the MIP-3α crystal dimer (1M8A), with the α helix in cylindrical representation (red cylinders). The blue cylinders represent the orientations of the helices observed in the solution structure. Therefore, in a dimeric conformation, the helix angles observed in the NMR solution structure would result in significant steric clashes. In addition, there is steric overlap from the flexible C terminus that is not shown in these structures.

