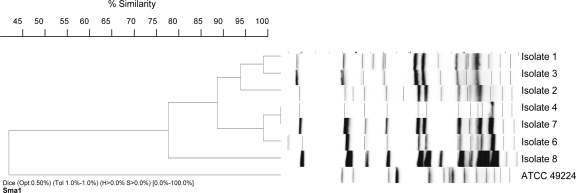
FIG. 2.
PFGE analysis of E. faecium isolates evaluated in this study. Analysis was performed using BioNumerics software. Dendrograms were generated using the unweighted-pair group method using average linkages and band-based Dice similarity coefficients. The optimization parameter for this evaluation was set to 0.5 and band position tolerance to 1.0%. Isolate 5 results are not shown in this figure, but that isolate exhibited a restriction pattern identical to that of isolate 4.

