
Figure 2.
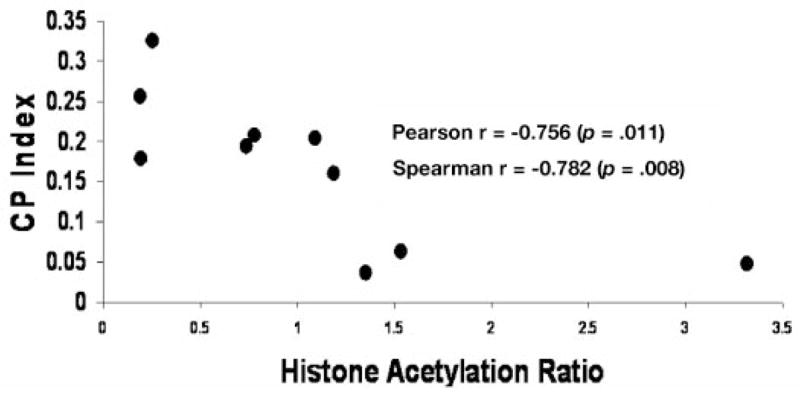
Scattergram depicting the relationship between histone acetylation and cell proliferation (CP index) in the cecum in experiment 1. Pearson r = −0.756 (p = .011) and Spearman r = −0.782 (p = .008).
Official websites use .gov
A
.gov website belongs to an official
government organization in the United States.
Secure .gov websites use HTTPS
A lock (
) or https:// means you've safely
connected to the .gov website. Share sensitive
information only on official, secure websites.
Scattergram depicting the relationship between histone acetylation and cell proliferation (CP index) in the cecum in experiment 1. Pearson r = −0.756 (p = .011) and Spearman r = −0.782 (p = .008).