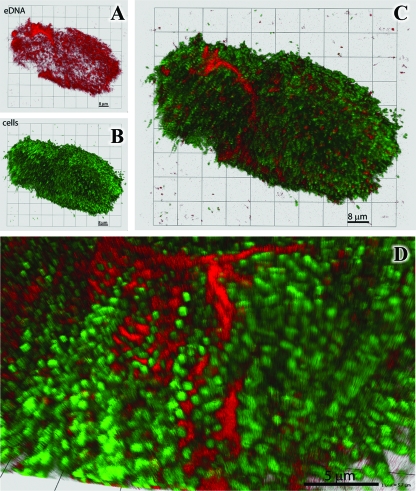
FIG. 7.
Representative 3-dimensional confocal images of the MR-1 multicellular aggregates. (A to C) Differential staining using fluorescent dyes for extracellular DNA (DDAO; red) (A) and intercellular DNA (Syto 59; green) (B) and a merged image (C) reveal the spatial distribution and relative volumetric percentages of cells and matrix material. (D) Cells (green) and DDAO stain (red) at high resolution show extracellular DNA staining between cells.

