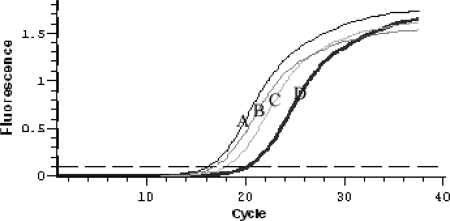
FIG. 2.
Plot depicting the amplification of the native dsz operon. The plot shows the accumulation of dszA, dszB, and dszC PCR products in real-time PCR as detected by the MJ Opticon2 continuous fluorescence detection system. dszA, dszB, and dszC cDNAs were used as the template. The threshold line for the calculation of the CT was set at 0.1. A, dszA; B, internal control gene (NADH gene); C, dszB; D, dszC.

