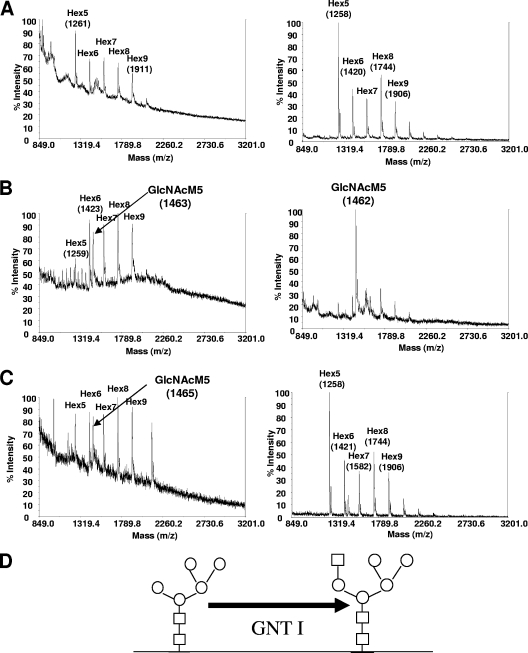
FIG. 3.
Whole-cell N-glycan analysis of Aspergillus strains expressing engineered GNT I. (A, B, and C) The images on the left compare whole-cell N-glycans from A. nidulans strain YR23.5-BC10, which served as a recipient for the GNT I constructs (A) (shown in Fig. 1B, left, and repeated here for clarity), with strain YR23.5-BC10-coNA15 (B) and strain YR23.5-BC10-mnnJ-NA (C). The images on the right show whole-cell glycan spectra for A. niger strain T2-BC10, which served as a recipient strain for the GNT I constructs (A), compared to N-glycans obtained from strain T2-BC10-coNA15 (B) and strain T2-BC10-mnnJ-NA (C). (D) Schematic diagram representing the function of GNT I, which generates GlcNAcMan5GlcNAc2 structures by the addition of one GlcNAc moiety on Man5GlcNAc2. GlcNAc residues are represented by squares and mannose (hexose) residues by circles.

