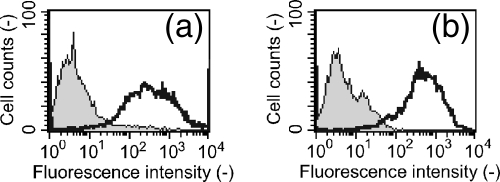
FIG. 5.
Flow cytometric analysis of recombinant lactic acid bacteria. In both figures, gray histograms indicate the results for control cells harboring pCUS, and white histograms indicate the results for L. plantarum NCIMB 8826 cells harboring pCA3-AmyA (a) and L. casei BLSJ 03135 cells harboring pCA3-AmyA (b). Cells were labeled with primary rabbit anti-AmyA serum, followed by secondary goat anti-rabbit IgG conjugated with Alexa Fluor 488. For each experiment, 10,000 cells were analyzed.

