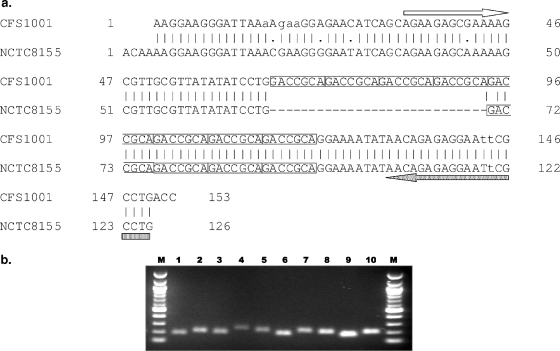
FIG. 2.
(a) Sequencing alignment of ESTR-3 loci from isolates CFS1001 and NCTC8155. The result from sequencing shows that the amplified fragment size variation at the loci between isolates CFS1001 (top) and NCTC8155 (bottom) is due to different numbers of -GACCGCA- repeats alone. The arrows indicate primer binding sites. (b) Agarose gel image of ESTR-3 from strains NCTC 8155 (182-bp product) (lane 1), CFS1001 (210-bp product) (lane 2), 82 (196-bp product) (lane 3), 102 (245-bp product) (lane 4), ATCC BAA-894 (217-bp product) (lane 5), 73 (182-bp product) (lane 6), 338 (217-bp product) (lane 7), 336 (203-bp product) (lane 8), 344 (168-bp product) (lane 9), and 109 (203-bp product) (lane 10). Lanes M, 100-bp molecular size marker (New England Biolabs, England).

