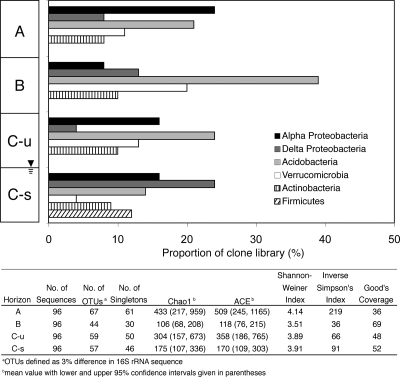
FIG. 1.
Proportions of major bacterial groups within clone libraries (384 random clones sequenced) obtained from soil aggregates from the A, B, unsaturated C (C-u), and saturated C (C-s) horizons. The table lists the diversity indices for the bacterial sequences recovered from the four horizons. Estimates of phylotype richness were calculated according to the abundance-based coverage estimate (ACE) and the bias-corrected Chao1 estimator. The Shannon-Weiner diversity index, which takes into account species richness and evenness, was also calculated. The evenness of the population is estimated by the inverse of the Simpson's index (1/D), which is sensitive to the level of phylotype dominance. The percentage of coverage was calculated using Good's coverage equation.

