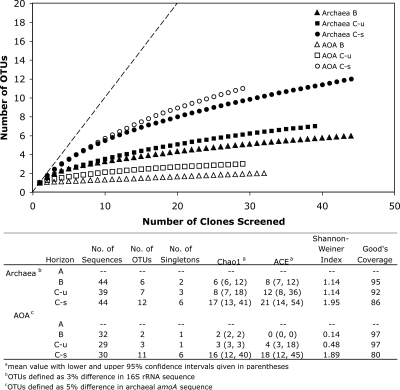
FIG. 3.
Rarefaction curves indicating archaeal 16S rRNA and amoA richness within clone libraries derived from the B, unsaturated C (C-u), and saturated C (C-s) horizons. The dashed line represents 1:1, indicative of infinite diversity. The table lists the archaeal 16S rRNA and amoA sequence diversity indices as described for Fig. 1. OTUs were defined as groups of sequences sharing 97% (16S rRNA) and 95% (amoA) nucleotide sequence identity.

