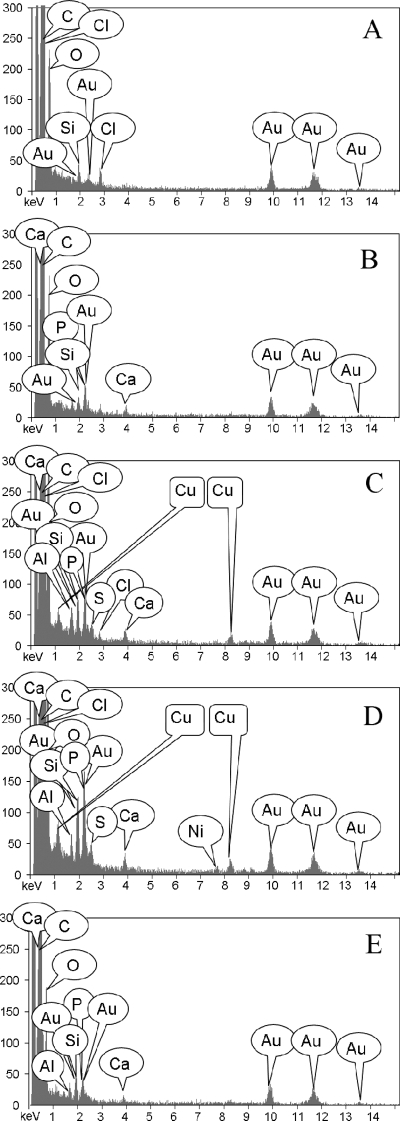
FIG. 6.
X-ray elemental spectra from a thin K. radiotolerans cell section. Each of the EDS panels corresponds to a specific sampling location from the thin section shown in Fig. 5C. (A) EDS spectrum of the embedding resin. (B) EDS spectrum of the extracellular milieu. (C and D) EDS spectra from two different locations within the cytoplasm. (E) EDS spectrum from the cell membrane and cell wall and the interstitial space between dividing cells within the cluster.

