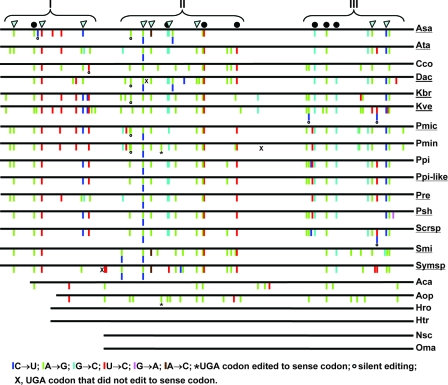
FIG. 2.
Schematic diagram of distribution of editing events in mitochondrial cytochrome c oxidase subunit I (cox1) in dinoflagellates. Symbols are as in Fig. 1. Brackets with Roman numerals indicate discrete clusters of editing events. Species abbreviations are as listed in Table 1, and those underlined are taxa whose gene sequences were analyzed in this study.

