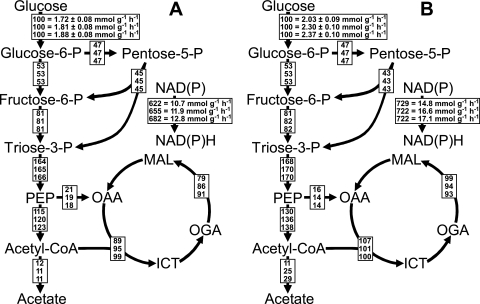
FIG. 5.
Relative distributions of absolute carbon fluxes in E. coli central carbon metabolism during steady-states I to III (A, top to bottom) and IV to VI (B, top to bottom) of the experiment shown in Fig. 4. All fluxes are normalized to the specific glucose uptake rates, which correspond to the absolute fluxes given for glucose phosphorylation. Absolute fluxes are also given for the net NAD(P)H formation rate, which corresponds to the total NAD(P)H formation by glucose catabolism minus the amount of NAD(P)H consumed for net biomass synthesis. The contribution of the PP pathway toward glucose-6-phosphate (glucose-6-P) consumption was set to 45% (16). PEP, phosphoenolpyruvate; CoA, coenzyme A; OAA, oxaloacetate; MAL, malate; OGA, 2-oxoglutarate; ICT, isocitrate.

