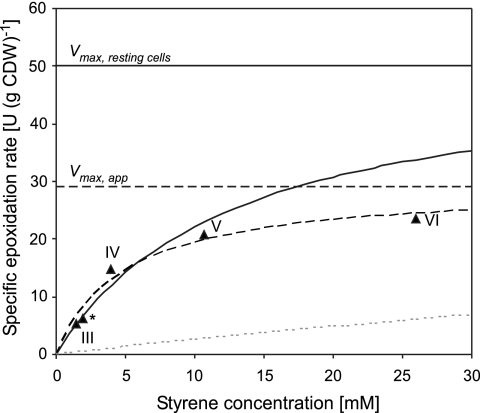
FIG. 7.
Michaelis-Menten plot of styrene concentrations in the organic phase and specific epoxidation rates measured during steady-states III to VI of continuous two-liquid-phase cultivation (Table 1; Fig. 4). A data point from an independent steady state is indicated by a star. The dotted curve shows the rates calculated via the Ks (64 ± 14 μM) for the aqueous single-phase system (54), aqueous styrene concentrations derived from the partition coefficient for styrene (2,990 ± 200) (54), and a Vmax of 50 U (g CDW)−1 as determined in activity assays after reduced induction. The dashed curve represents a weighted nonlinear regression based on data from steady-states III to VI and *, giving a Ks of 4.9 ± 1.3 mM and an apparent Vmax of 29.0 ± 2.7 U (g CDW)−1 (indicated as Vmax,app). The solid curve represents a weighted nonlinear regression based on data from steady-states III to V, as well as steady-state *, and on a Vmax of 50 U (g CDW)−1 as determined in separate resting-cell activity assays (indicated as Vmax,resting cells). The estimated Ks is 12.7 ± 1.9 mM.

