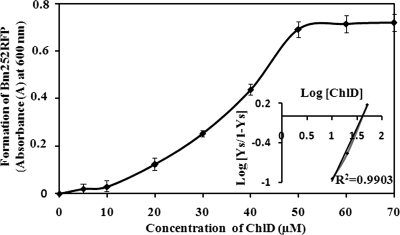
FIG. 5.
Chlide saturation curve and Hill's plot. Formation of Bm252RFP was calculated by monitoring the absorbance peak at 600 nm and was plotted against the Chlide (ChlD) concentration. A sigmoidal curve was obtained, and Hill's plot was calculated (inset picture) according to the following equation: log (Ys/[1 − Ys]) = n log [Chlide] − log Kd, where Y is the fractional concentration of Chlide calculated from absorbance values, [Chlide] is Chlide or ligand concentration, Kd is the dissociation constant, and n is the Hill coefficient. Bars represent standard deviations calculated from five different experiments.

