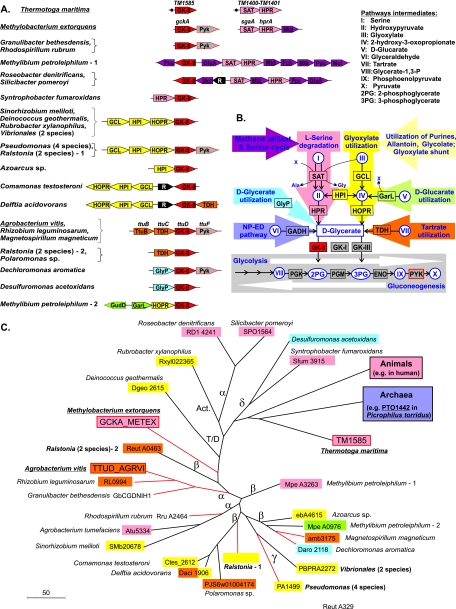
FIG. 1.
Genomic and functional context of glycerate kinase enzymes in bacteria. In all panels, matching colors are used to mark components of distinct pathways related to glycerate metabolism. (A) Examples of chromosomal clusters containing GK-II genes in bacteria. Genes (shown by arrows) from the same metabolic pathway are marked by matching colors. Transcriptional regulators are shown in black. The species with experimentally characterized pathways and enzymes are underlined. The presence of a common regulatory site upstream of the serine degradation genes in T. maritima is shown by black dots. (B) Reconstruction of metabolic pathways involving d-glycerate. Abbreviations for pathway intermediates (in circles and ovals) are given at the top. ENO, enolase. Different metabolic pathways and their respective enzymes are denoted by background color arrows and boxes marked by the same matching colors. (C) Phylogenetic tree of selected GK-II family proteins in bacteria whose biological role was tentatively identified using genome context analysis. Background colors reflect chromosomal clustering of GK-II genes with the genes from the respective metabolic pathways. Clustering of GK-II with the pyk genes is marked by red lines. The branching point of GK-II proteins from eukaryotes and archaea are indicated and colored according to their biological roles reported elsewhere. Abbreviations for taxonomic groups: α, β, γ, and δ denote alpha-, beta-, gamma-, and deltaproteobacteria; Act., Actinobacteria; T/D, Thermus/Deinococcus group.

