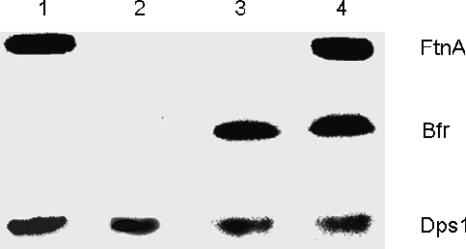
FIG. 2.
Analysis of 59Fe-labeled E. chrysanthemi proteins from soluble cell extracts after electrophoresis on a native 8% polyacrylamide gel. Bacteria were grown in L medium to an OD600 of 0.4, and 59FeCl3 was added at a final concentration of 1 μM. Samples were collected 90 min after the addition of iron. Whole-cell extracts were prepared as described in Materials and Methods. The lower band probably corresponds to the Dps1 protein of E. chrysanthemi, as it is missing in a Dps1 gene mutant (data not shown). Lane 1, bfr mutant; lane 2, bfr ftnA mutant; lane 3, ftnA mutant; lane 4, wild-type strain.

