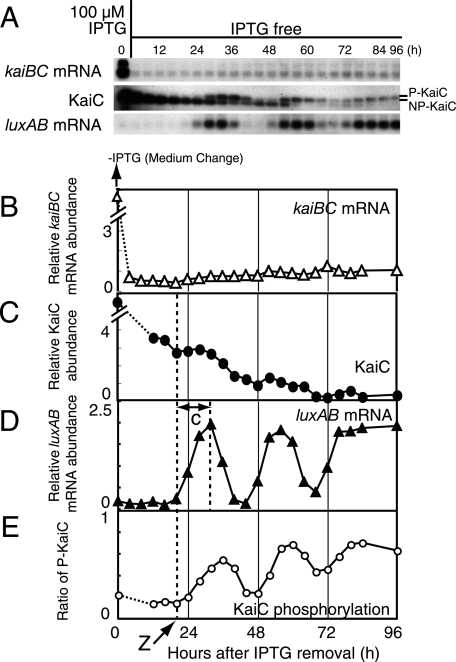
FIG. 4.
Circadian rhythm generation after recovery from strong repression of PkaiBC. (A) Temporal profiles of kaiBC mRNA accumulation (upper panel), KaiC protein accumulation (middle panel), and luxAB mRNA accumulation (lower panel) after the removal of 100 μM IPTG. NUC0220 cells were grown in the presence of 100 μM IPTG for 36 h and then transferred to fresh medium lacking IPTG. Removal of the IPTG was performed as in Fig. 1D. After the removal of IPTG, the cells were collected every 4 h for 84 h and at hour 96. Protein and mRNA levels were examined by Western and Northern blot analyses. Total protein (1 μg) and total RNA (1 μg) were used for the analyses. The data shown are representative of at least three independent experiments. (B to E) Quantitative analyses of kaiBC mRNA (B), KaiC protein (C), luxAB mRNA (D), and phosphorylation ratio of KaiC (E). The experimental procedures and the presentation of the data are the same as for Fig. 2. Dashed lines and arrow (“Z”) indicate the time point at which the initial increase in luxAB mRNA began. “c” indicates the transition time for the derepression of PkaiBC to the maximum level. The signals of mRNA (B) and KaiC (C) at time zero were saturated because of the presence of 100 μM IPTG. The signals at this time points could be estimated as 10, at least.

