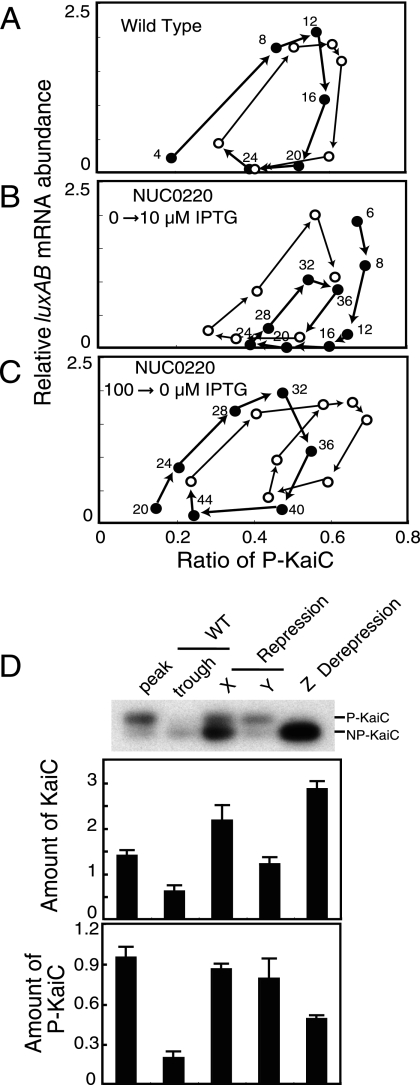
FIG. 5.
Correlation of kaiBC promoter activity with the KaiC phosphorylation ratio (A to C) and the amount of KaiC at repression or derepression of PkaiBC (D). (A) Positive correlation between activation of the kaiBC promoter and the KaiC phosphorylation ratio. The relationships between luxAB mRNA accumulation and KaiC phosphorylation in wild type (A; see Fig. S2 in the supplemental material), NUC0220 after the addition of 10 μM IPTG (B; see Fig. 3), and NUC0220 after the removal of IPTG (C; see Fig. 4) were examined. The data shown in Fig. S2 in the supplemental material and Fig. 3 and 4 were replotted on a graph with the KaiC phosphorylation ratio on the x axis and the luxAB mRNA amount on the y axis. The first half of the trace is plotted with closed circles, and the second half is plotted by open circles. The number in the figure indicates a time point in each experiment. (D) Quantitative estimation of KaiC required for the repression and derepression of kaiBC promoter activity. KaiC accumulation at the peak (CT16) and trough (CT4) in the wild type and at three time points—“X,” “Y” (Fig. 2 and 3; for repression), and “Z” (Fig. 4; for derepression)—in NUC0220 were quantitatively reexamined by Western blot analysis. The upper panel shows the total amount of KaiC, and the lower panel shows the amount of P-KaiC. The average level of KaiC in the wild type was standardized to 1. The amount of P-KaiC was calculated from the relative KaiC amount and the phosphorylation ratio. Bars represent the means ± the SD from three independent experiments.

