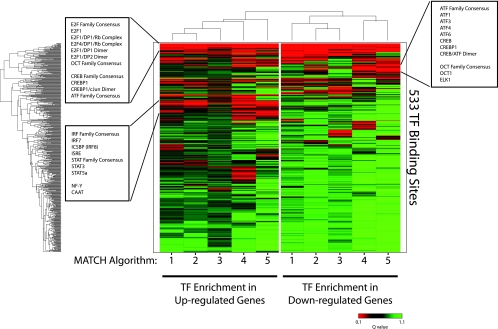
FIG. 3.
Enrichment of TF binding sites in the promoters of differentially expressed genes. Hierarchical clustering and heat map of Q values calculated for the enrichment of TF binding sites in the promoters of differentially expressed genes in CD4+ CD25+ T cells from untreated HIV+ individuals compared to those from HIV− individuals. The color represents the degree of significance for the Q value (green = low significance; red = high significance). Each row represents a specific TF binding site specified by a high-quality position weight matrix in TRANSFAC, while each column reflects a different algorithm (user-defined cutoff) for significance in identifying a TF binding site in MATCH: 1, minimize the sum of both error rates; 2, mat. sim. = 0.90; core sim. = 0.90; 3, mat. sim. = 0.80; core sim. = 0.85; 4, minimize false positives; 5, mat. sim. = 0.95; core sim. = 0.95.

