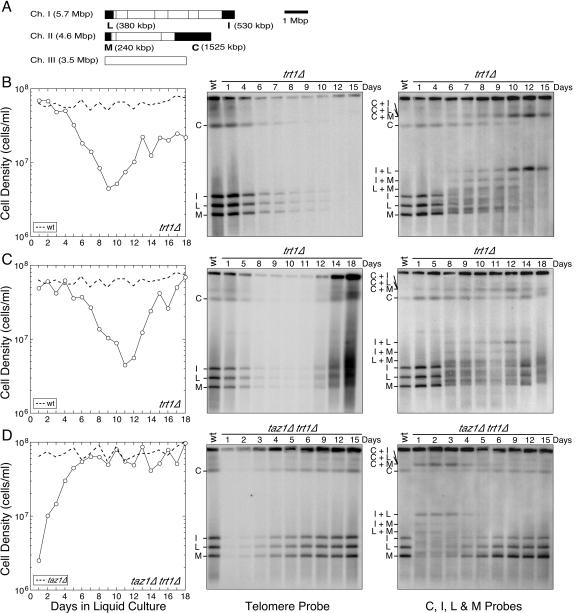
FIG. 1.
PFGE analysis for trt1Δ and taz1Δ trt1Δ cells. (A) NotI restriction map of S. pombe chromosomes. The telomeric fragments C, I, L, and M are filled in black. (B to D) trt1Δ/trt1+ or taz1Δ/taz1+ trt1Δ/trt1+ diploid strains were sporulated, and trt1Δ (B and C) or taz1Δ trt1Δ (D) cells were selected. For trt1Δ cells, two independent cultures, which produced survivors with an intermediate growth rate (B) or a wild-type-like growth rate (C), are shown. The left panels show the growth characteristics of cells after germination in liquid culture. For reference, results from growth curve experiments for wild-type (trt1+) or taz1Δ cells are also plotted (dotted lines). The middle panels show PFGE results for NotI-digested S. pombe chromosomal DNA hybridized with telomere GT-rich repeat specific probe. The right panels show PFGE results for NotI-digested S. pombe chromosomal DNA hybridized with probes for the C, I, L, and M bands.

