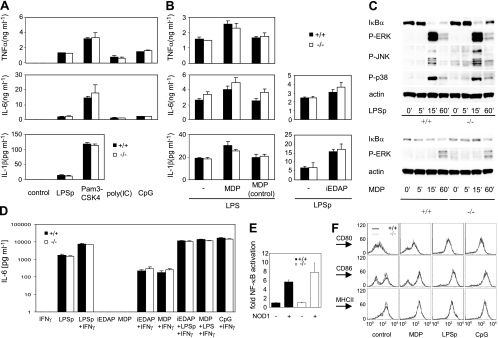
FIG. 5.
Normal TLR and NOD signaling in CARD6−/− cells. (A and B) Normal TNF-α, IL-6, and IL-1β production. CARD6+/+ and CARD6−/− BMDMs were stimulated with LPS, Pam3-CSK4, poly(IC), or CpG (A) or MDP, the MDP d-d-isomer control, or iE-DAP (B) in the presence of a low concentration of LPS. Production of TNF-α, IL-6, and IL-1β was determined by ELISA. (C) Normal IκBα degradation and MAPK activation. CARD6+/+ and CARD6−/− BMDMs were stimulated with LPS (upper panels) or MDP (lower panels) for the indicated times. IκBα degradation, phosphorylation of ERK1/2, p38, and JNK, and actin protein levels were determined by Western blotting. (D) Normal IL-6 production in the presence of IFN-γ. CARD6+/+ and CARD6−/− BMDMs were stimulated with IFN-γ, LPSp (low concentration), iE-DAP, or MDP or the indicated combinations of these stimuli or CpG plus IFN-γ, and IL-6 production was determined by ELISA. (E) Normal NF-κB activation. CARD6+/+ and CARD6−/− MEFs were cotransfected with empty vector or the pcDNA3-NOD1-HA expression construct plus the pBVIx-Luc and pRL-TK reporters, and the increase in NF-κB activation was determined. (F) Normal DC maturation in response to NOD2 and TLR stimulation. BMDCs from CARD6+/+ and CARD6−/− mice were stimulated for 24 h with MDP, LPSp, or CpG as described in Materials and Methods. CD11c-positive cells were analyzed for cell surface levels of CD80, CD86, and MHCII by flow cytometry. Results, shown as bar graphs, are the means of normalized values ± standard deviations for triplicate cultures and are representative of at least three (A, B, and D) or two (E) independent experiments. Results shown in panels C and F are one trial representative of at least two or three independent experiments, respectively.

