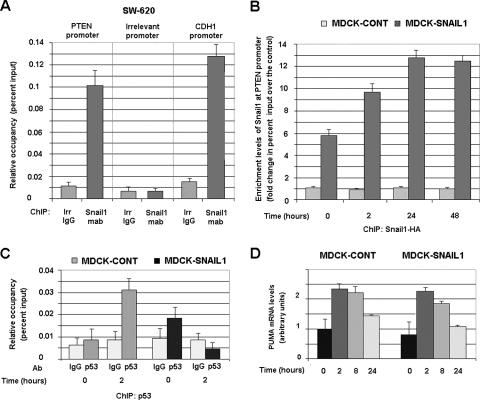
FIG. 6.
Snail1 is recruited to the PTEN promoter “in vivo” in response to γ radiation. (A) Snail1 binds to the PTEN promoter in SW-620 cells. ChIP assays were carried out by using an MAb specific for Snail1 or an irrelevant (irr) IgG as described in Materials and Methods. The presence of sequences corresponding to PTEN, E-cadherin (CDH1), or an irrelevant promoter was analyzed and represented as relative occupancy (percent input). (B) Binding of Snail1 to the PTEN promoter is up-regulated after irradiation. ChIP assays were performed by immunoprecipitating Snail1-HA with an anti-HA MAb or an irrelevant IgG from MDCK-Snail1 cells at different times after γ radiation. Enrichment levels in Snail1 at the PTEN promoter correspond to the change of the percent input calculated with respect to the amount detected in the immunoprecipitation carried out with an irrelevant IgG. In a representative experiment, the percentages of input obtained with the IgG or with anti-HA MAb in the control (cont) clones (not expressing Snail1) varied between 0.005 and 0.007; the values obtained with anti-HA MAb in MDCK-Snail1 cells at 0, 2, 24, and 48 h after γ radiation were 0.035, 0.07, 0.08, and 0.07, respectively. Similar results were obtained when the binding of Snail1-HA to the PTEN promoter was analyzed in another clone of MDCK-Snail1 cells. (C) Snail1 prevents the interaction of p53 with PTEN promoter in response to γ radiation. ChIP assays were performed by immunoprecipitating p53 from the indicated cells before or 2 h after γ radiation. Data are represented as described for panel A. Panels A to C of this figure show the averages ± SDs (error bars) of three independent experiments. (D) Snail1 does not prevent Puma up-regulation in response to γ radiation in MDCK cells. The levels of endogenous Puma were detected by quantitative RT-PCR, as described in Materials and Methods, by using RNA isolated from the indicated cells prior and after γ radiation. Results are presented as the averages ± SDs (error bars) from three independent experiments.

