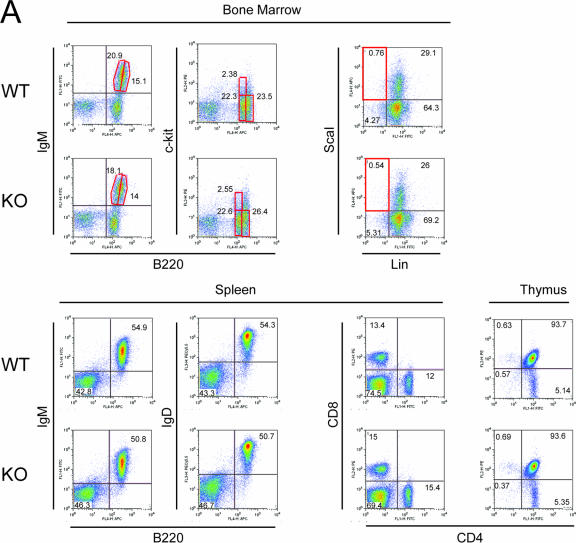
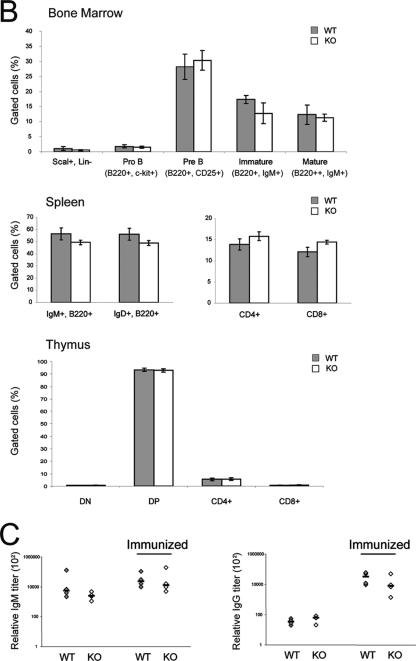
FIG. 6.
Analysis of lymphocyte development and immune response in HDAC6-deficient mice. (A) FACS analysis of 10-week-old wild-type (WT) or HDAC knockout (KO) mice. Bone marrow cells, thymocytes, or splenocytes were analyzed by flow cytometry after staining with FITC-, PE-, PE Cy5.5-, and APC-conjugated antibodies. The dot plots show data from one representative animal of each genotype; the percentage of cells in the respective quadrants are indicated. (B) The proportions of the different cell populations analyzed are presented as histograms showing the means ± standard deviations (error bars) of data from five mice of each genotype. The proportions of double-negative (DN), double-positive (DP), CD4+, and CD8+ cells from the thymus are shown. (C) Moderately impaired immune response in the absence of HDAC6. Wild-type and HDAC6-deficient mice were immunized with DNP-KLH, and 10 days later, serum immunoglobulin levels were measured by ELISAs (n = 4). Each symbol shows the value for one mouse, and the bar shows the mean for the four mice in each group.


