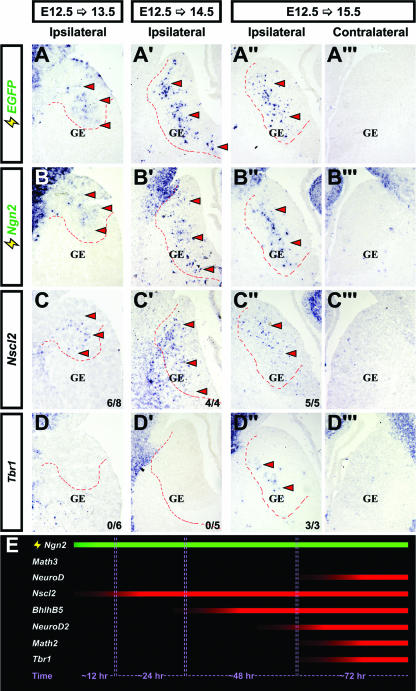
FIG. 4.
Kinetics of ventral telencephalic gene induction downstream of Ngn2. Frontal sections of ventral telencephalons were electroporated at E12.5 with pCIG2-Ngn2 and harvested at E13.5 (A to D), E14.5 (A′ to D′), or E15.5 (A" to D"). Untransfected E15.5 telencephalons (contralateral) are shown in panels A‴ to D‴. Expression of the EGFP, Ngn2, Nscl2, and Tbr1 genes (identified along the left side of the figure) is also shown. Dashed outlines indicate the approximate location of transfected cells. In panels C, C′, C", D, D′, and D", the numbers of times depicted results were observed are also indicated (lower-right corners). Arrowheads indicate ectopic transcripts. (E) Schematic illustrating the kinetics of gene induction downstream of Ngn2 in the ventral telencephalon (continuous expression; green bar), showing approximate time required for detectable levels of each transcript to accumulate.

