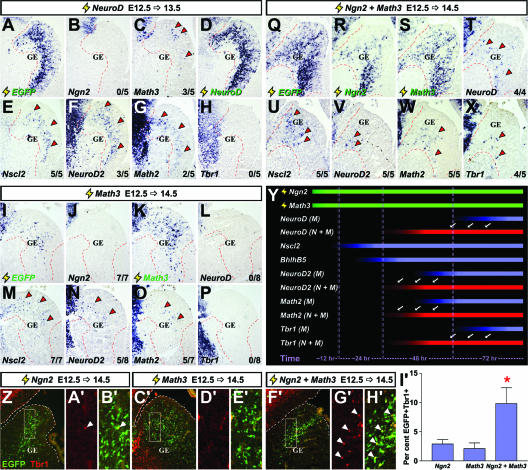
FIG. 6.
Comparing the kinetics of cortical gene induction downstream of NeuroD, Math3, and Ngn2 plus Math3 in the ventral telencephalon. (A to H) Frontal sections of brains electroporated at E12.5 with pCIG2-NeuroD (3 μg/μl) and harvested at E13.5. (I to P) Frontal sections of brains electroporated at E12.5 with pCIG2-Math3 (3 μg/μl) and harvested at E14.5. (Q to X) Frontal sections of brains electroporated at E12.5 with pCIG2-Ngn2 and pCIG2-Math3 (1.5 μg/μl each) and harvested at E14.5. Localizations of the transcripts are shown for the EGFP, Ngn2, Math3, NeuroD, Nscl2, NeuroD2, Math2, and Tbr1 genes (identified on the panels). Arrowheads in panels A to X indicate ectopic expression. (Y) Schematic depicting shifts in the kinetics of gene induction when Ngn2 and Math3 are expressed together (N+M) versus Math3 expressed alone (M). Green bars depict overexpressed genes, red bars depict genes with accelerated kinetics of induction when Ngn2 and Math3 are coexpressed (shift highlighted by arrows), and blue bars show gene expression induced by Math3 alone. (Z to H′) Frontal sections of brains electroporated at E12.5 with pCIG2-Ngn2 (3 μg/μl), pCIG2-Math3 (3 μg/μl), and pCIG2-Ngn2 plus pCIG2-Math3 (1.5 μg/μl each) harvested at E14.5 (genes are identified above the panels). White boxes in Z, C′, and F′ indicate the positions of higher magnification images displayed shown in panels A′, B′, D′, E′, G′, and H′). Sections were stained with Tbr1 (red; arrowheads indicate double-positive cells). (I′) The percentage of EGFP-positive cells that expressed Tbr1. *, significantly different versus Ngn2 (P < 0.05) and significantly different versus Math3 (P < 0.01).

