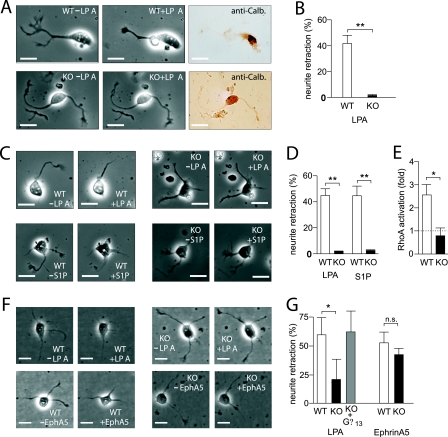
FIG. 7.
Effect of LPA and S1P on neurite morphology of wild-type and nestin-Cre; Gna12−/−; Gna13flox/flox neurons. (A and B) Wild-type (WT) and nestin-Cre; Gna12−/−; Gna13flox/flox (KO) neurons from E17.5 cerebellar cortices were studied by live-cell imaging before (−LPA) and after (+LPA) addition of LPA. Thereafter, cells were stained for calbindin (anti-Calb.) to identify embryonic cerebellar Purkinje cells. Shown are representative images of embryonic Purkinje cells (A) as well as a statistical evaluation of neurite retraction in response to LPA (B). (C to G) Cortical plate neurons were isolated from wild-type (WT), nestin-Cre; Gna12−/−; Gna13flox/flox (KO; C and D), or NEX-Cre; Gna12−/−; Gna13flox/flox (KO; E to G) E16.5 embryonic brains. Isolated cells were then monitored by live-cell imaging before (−LPA/−S1P) or after addition of LPA (+LPA), S1P (+S1P), or ephrin-A5 (EphA5) as indicated. The gray bar in panel G (KO + Gα13) indicates LPA-induced neurite retraction in cortical neurons transfected with a plasmid encoding Gα13. Shown are representative images (C and F) as well as a statistical evaluation of the effects of 10 μM LPA, 1 μM S1P, and 2 μg/ml ephrin-A5 on neurite retraction in wild-type and mutant cortical plate neurons (D and G). Fifteen to forty-five cells per embryo were analyzed, and the total number of embryos per experiment was three to six. (E) Effect of 10 μM LPA on RhoA activity in cortical neurons from wild-type (WT) or NEX-Cre; Gna12−/−; Gna13flox/flox (KO) E16.5 embryonic brains. Shown is the RhoA activation relative to the basal activity (=1). All values are means ± standard deviations; *, P < 0.05; **, P < 0.01; n.s., not significant.

