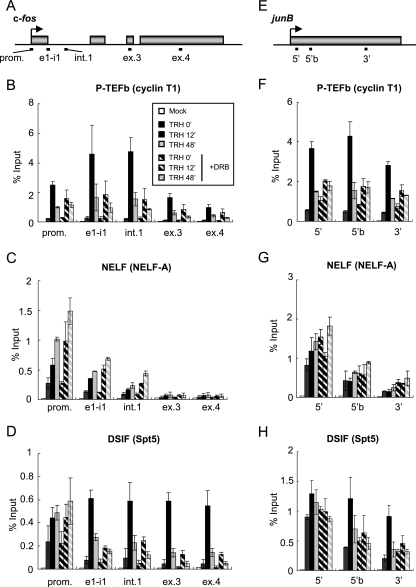
FIG. 1.
Association of P-TEFb, NELF, and DSIF with the c-fos and junB genes. (A) Rat c-fos (GeneID, 314322) genomic locus; the boxes represent exons. The bars below the genes show the positions of the primer sets used in ChIP assays: promoter-proximal region (prom.), exon 1/intron 1 junction (e1-i1), intron 1 (int.1), exon 3 (ex.3), and exon 4 (ex.4). (B to D) Distribution of P-TEFb and N-TEFs on the c-fos gene. ChIP assays were performed with an anti-cyclin T1 antibody (B), an anti-NELF-A antibody (C), and an anti-Spt5 antibody (D) with chromatin at various time points after TRH stimulation (0 [basal condition], 12, and 48 min) in the absence (filled bars) or presence (hatched bars) of DRB. The density on the c-fos gene was quantified by using real-time PCR and is presented as a percentage of the input (the mean of two experiments is shown; the error bars represent the range). (E) Rat junB (GeneID, 24517) genomic locus; the box represents the single exon. The bars below the genes show the positions of the primer sets used in ChIP assays: the 5′ region (5′), 5′ region b (5′b), and 3′ region (3′). (F to H) Distribution of P-TEFb and N-TEFs on the junB gene (as in panels B to D).

